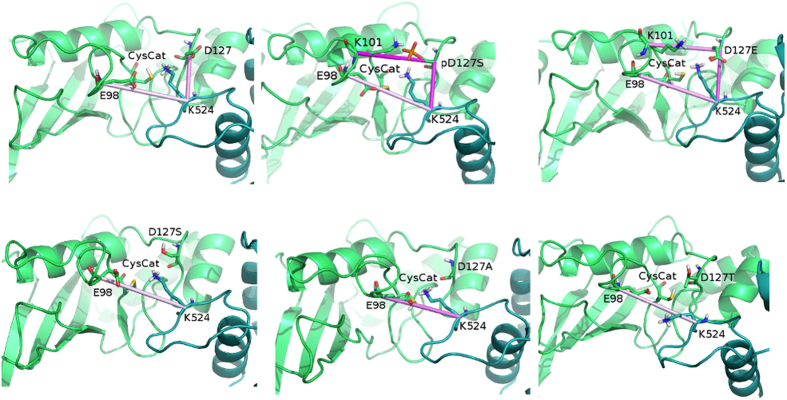
Figure 5. Network of electrostatic interactions between the substrate lysine and the residues surrounding the catalytic cleft of the E2 enzyme in MD simulations of wild type, mutant and phosphorylated Ube2I-RanGAP1 complexes.
RanGAP1 and the E2 enzyme are shown as green and blue marine cartoons, respectively. Pink lines represent salt bridges with different shades of colors according to their persistence in the MD simulations.

