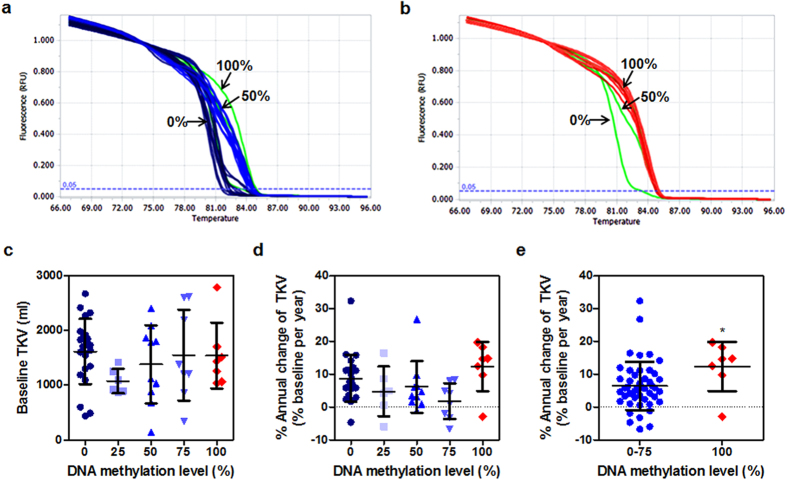
Figure 4. Correlation between hypermethylation of MUPCDH promoter and the increased rate of total kidney volume (TKV) change in ADPKD.
(a,b) Methylation-sensitive high resolution melting (MS-HRM) analysis was carried out using urine sediment genomic DNA from patients with autosomal dominant polycystic kidney disease (ADPKD). Bisulfite converted human control DNA (0, 50, 100% methylated) was used as quantification standards for MS-HRM analysis (green lines). Based on control DNA, ADPKD patients were classified into five groups as a methylation level of MUPCDH promoter region. Dark blue and blue lines indicate unmethylated and hemi-methylated samples. Red line showed fully methylation pattern. (c) Baseline TKV and (d) rate of annual change of TKV according to MUPCDH promoter methylation level were shown. (e) When the subjects were grouped into 0–75% (n = 46) vs. 100% (n = 7) methylation level, percent change in TKV per year was significantly faster in 100% group than 0–75% (median 14.6% vs. 5.9% per year, *P = 0.019 by Mann-Whitney test).

