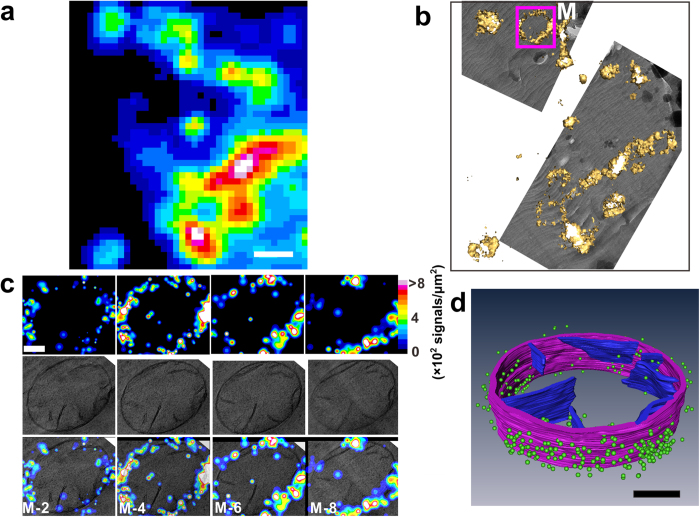
Figure 4. 3D correlative images from cryo-sections of HEK293 cells expressing TOM20-Dronpa.
(a) Summed image from single-molecule data. Scale bar, 1 μm. (b) Correlative isosurface reconstruction of a PALM image with low magnification TEM data. (c) Each column in c was from a single layer of 3D PALM (top), single layer of cryo-ET (middle) and correlative representations (bottom), respectively. The structural resolution of the whole 3D data set was estimated to be 73.7 ± 5 nm employing the Fourier ring correlation method35,36, corresponding to a density of 749 signals/μm2. Scale bar, 200 nm. (d) Correlative 3D segmentation of cryo-ET data with single-molecule localization of fluorescent proteins. Mitochondrial outer membrane and cristae are denoted by purple and blue, respectively. Dronpa molecules are denoted by green dots. For clear demonstration, we kept those signals that have higher localization precision (2.9/3.0 nm, mean/median), which rejects 90% of the signals. Scale bar, 200 nm.

