
Figure 1. Principal component analysis of gut bacteria at the OTU level.
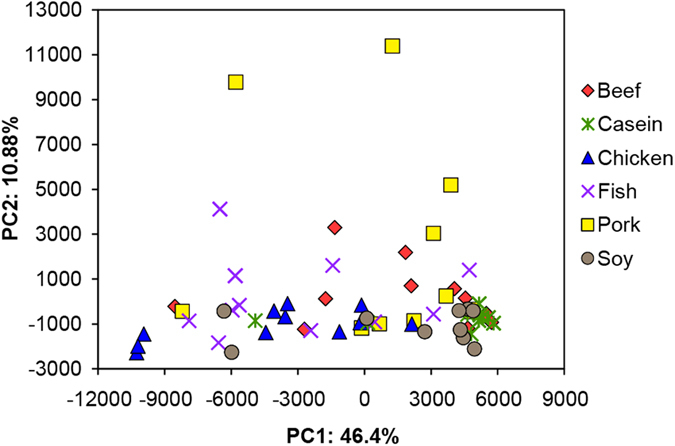
The numbers of animals for beef, casein, chicken, fish, pork and soy protein groups are 11, 10, 11, 11, 11, and 10, respectively. Red, olive green, blue, purple, yellow and grey color represent beef, casein, chicken, fish, pork, and soy protein groups, respectively. Each point represents one animal.