
Figure 5. Relative abundance of Lactobacillus in rat caecum.
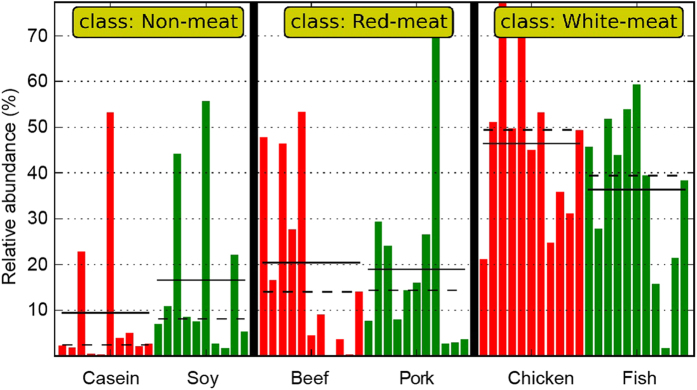
The means and medians are shown as solid and dashed lines in each group. Each column represents one animal and there are totally 64 animals. The numbers of animals for beef, casein, chicken, fish, pork and soy protein groups are 11, 10, 11, 11, 11 and 10 respectively. These samples were further classified into non-meat protein class, red meat protein class and white meat protein class.