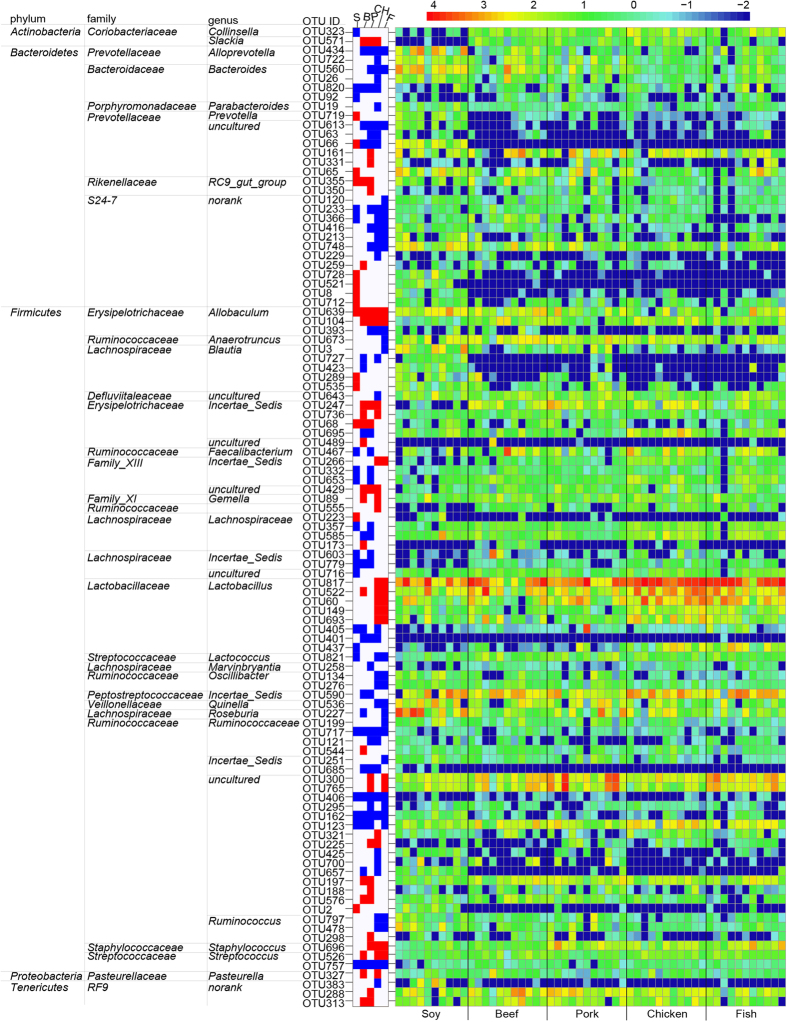
Figure 6. Heatmaps of gut bacteria at the OTU level using LefSe.
The figure includes three parts. The right part shows the relative abundance (log 10 transformation) of OTU. Each column represents one animal and each row represents one OTU. The numbers of animals for beef, casein, chicken, fish, pork and soy protein groups are 11, 10, 11, 11, 11 and 10 respectively. The middle part shows the change folds of OTU that changed significantly (p < 0.05) when compared to casein group. Red denotes an increase while blue denotes a decrease. S, soy protein group; B, beef protein group; P, pork protein group; CH, chicken protein group; F, fish protein group. The left table lists significant difference of OTU and corresponding phyla, families and genera.

