
Figure 8. The serum levels of LBP in response to dietary proteins.
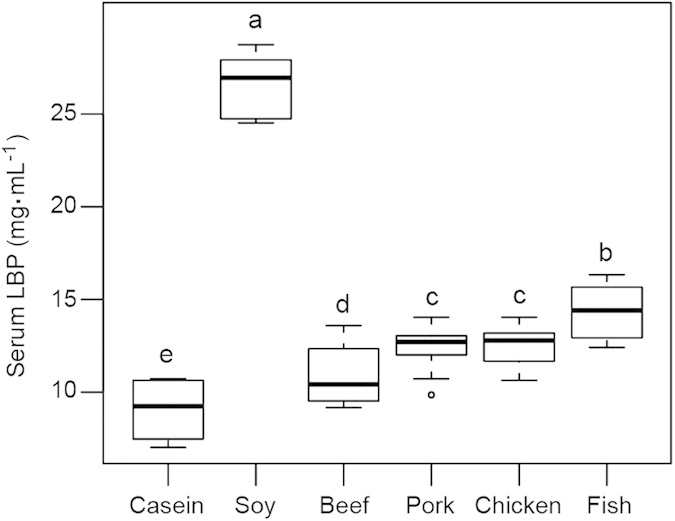
Note: The numbers of animals for beef, casein, chicken, fish, pork and soy protein groups are 11, 10, 11, 11, 11, and 10 respectively. In a typical box plot, the top of the rectangle indicates the third quartile, a horizontal line near the middle of the rectangle indicates the median, and the bottom of the rectangle indicates the first quartile. A vertical line extends from the top of the rectangle to indicate the maximum value, and another vertical line extends from the bottom of the rectangle to indicate the minimum value. The relative vertical spacing between the labels reflects the values of the variable in proportion. The dot in pork protein group shows an outlier. The data were analyzed by one-way analysis of variance and means were compared by the procedure of Duncan’s multiple comparison. a,b,c,d Means with different superscripts differed significantly (p < 0.05).