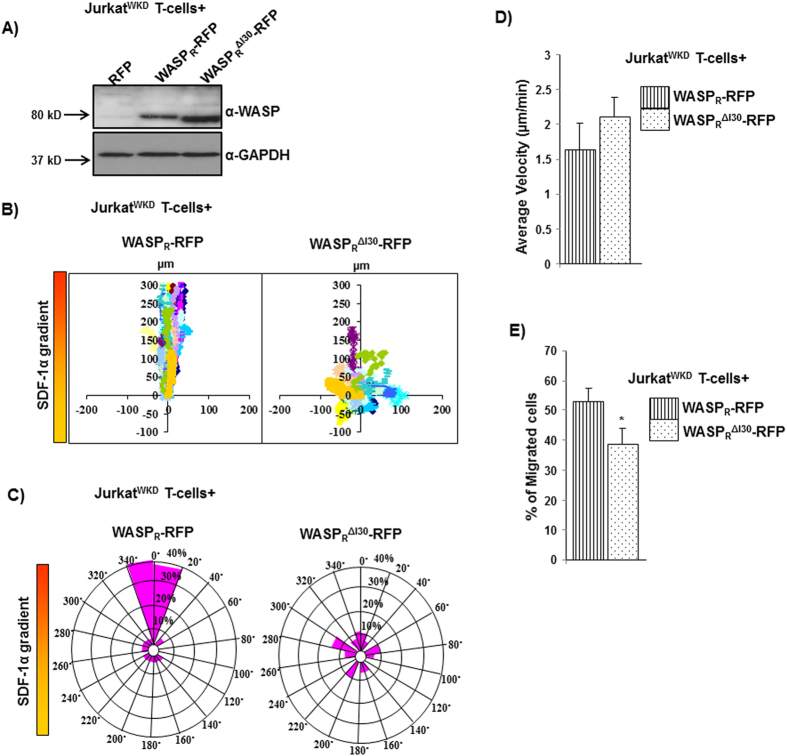
Figure 4. I30 region of WASP critical for Jurkat T-cell chemotaxis.
(A) Expression levels of RFP tagged WASPR and WASPRΔI30 in JurkatWKD T-cells. (B) Vector plots representing the migration path of JurkatWKD T-cells expressing (1) WASPR-RFP, (2) WASPRΔI30-RFP in Dunn chamber assay. (C) Circular histograms for analysis of overall directionality of migration (final position of cells in each 20° sector). (D) Migration velocity of total 60 randomly selected cells of cell type as in panel B. (E) Transwell migration of JurkatWKD T-cells expressing (1) WASPR-RFP, (2) WASPRΔI30-RFP and percentage of cells migrated to the bottom well was counted. *P < 0.05.

