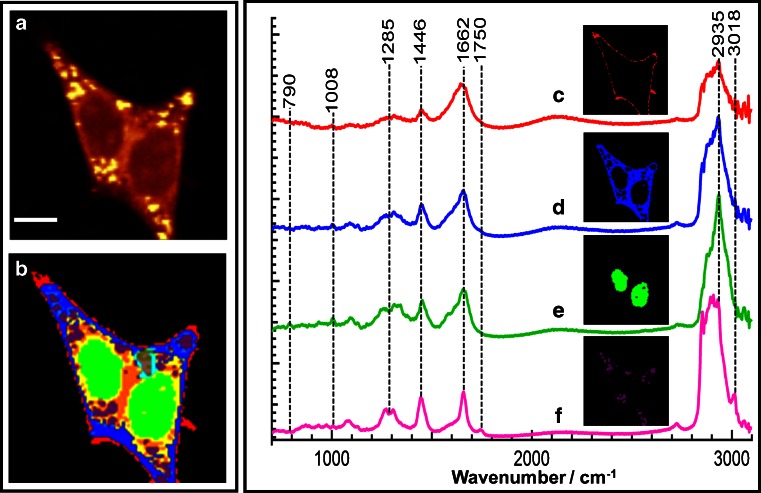
Fig. 4.
a Raman intensity image constructed in the C–H stretching region of SW-48 cells. b hierarchical cluster analysis (HCA) results based on the Raman data shown in a. Mean spectra and the respective spatial distribution of HCA clusters: c plasma membrane, d cytoplasm, e nucleus, and f lipid droplets. The scale bar in a is 9 μm

