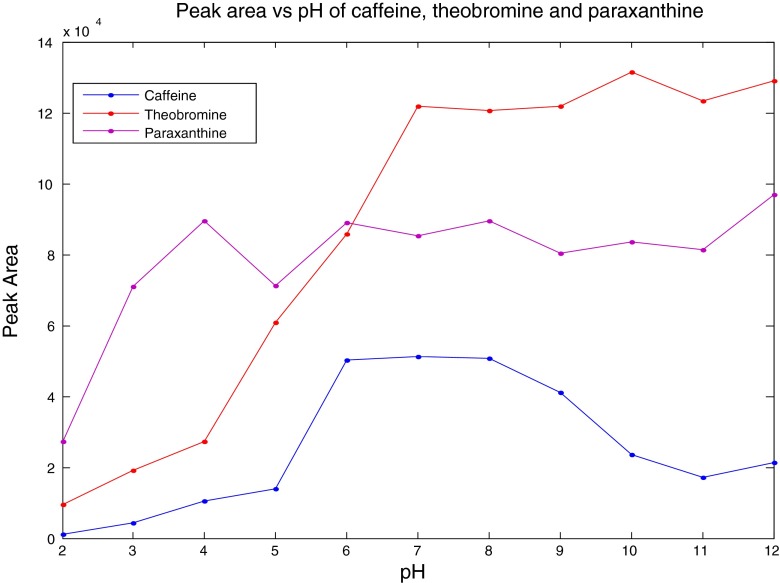
Fig. 2.
Plots of SERS peak area for the C=O deformation band at 693 cm−1 against pH of the SERS association for caffeine and paraxanthine, whilst the peak at 1303 cm−1 (ν(C–N) + ρ(CH3)) is plotted for theobromine. Points are the average of five repeat measurements, and the % relative standard deviations were between 0.8 and 2.7 %

