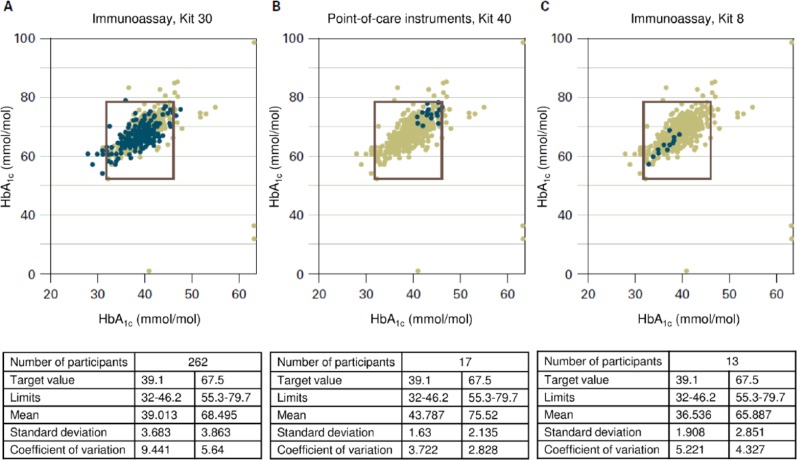
Figure 1.
Results in mmol/mol of HbA1c measurements obtained in interlaboratory comparisons with 3 different methods.20 The results plotted were obtained with the measurement method in question on the HbA1c samples A (x axis) and B (y axis). The square drawn in defines the maximum permitted deviation of ±18% from the target value. As the differing number of blue points shows, these are used with varying frequency. The results from all measurements with the different methods are entered in grey. In the tables below the figures, the results with samples A (left column) and B (right column) are shown next to the number of participants using the method in question. The target value of these samples is stated with the limits within which the results should lie. The mean of all results, with the standard deviation and the variation coefficient gives an idea of how good the method is overall, but also what the observed deviations are. Figure 1A presents the results from a frequently used immunological assay method. The results in Figure 1B are all in the upper right corner and those in Figure 1C in the lower left corner; that is, with 1 method there is a trend toward higher measurements and with the other toward lower values. Mean values obtained in the interlaboratory comparison with the 2 HbA1c samples (B: 6.16% and 9.06% [43.8 and 75.5 mmol/mol]; C: 5.49% and 8.18% [36.5 and 65.9 mmol/mol]) differ accordingly.

