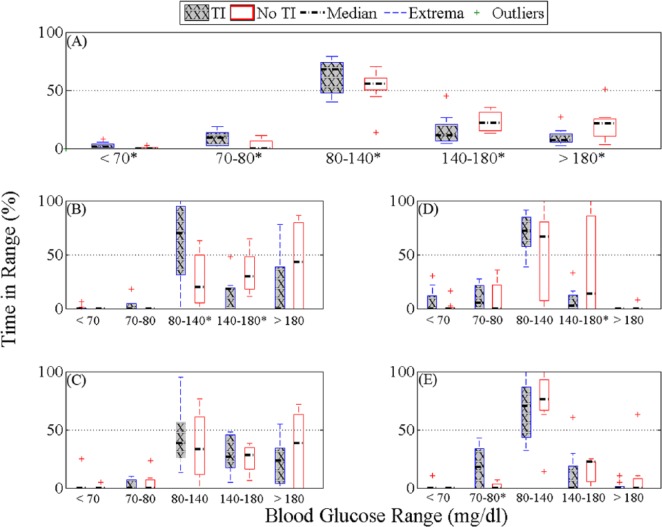
Figure 2.
Percentage time in different glycemic ranges based on YSI BG in the TI case (gray with diagonal line) and the no TI case (white) for the whole study (A), start of dinner to 5 hours after (B), start of breakfast to 5 hours after (C), start of exercise to 3 hours after (D), and the overnight period (12:00 am to 7:00 am) (E). *P value from the paired t test < .05 comparing the results of the TI and the no TI cases.

