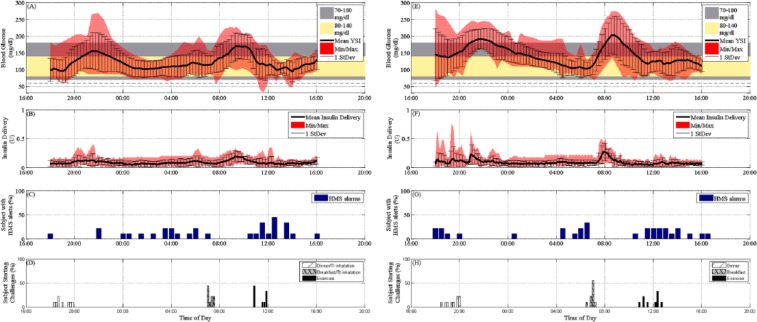
Figure 3.
Glucose summary results of all TI trials are summarized in (A) as mean YSI BG, 1 standard deviation (SD), and minimum and maximum YSI BG values. The control objective (80-140 mg/dl) is shown as the light yellow band and the clinically accepted region (70-180 mg/dl) as the gray band. The mean insulin delivery via CSII for all trials is shown in (B) along with 1 SD and the minimum and maximum of the insulin delivery values. The percentage of subjects received HMS alarms in a 30-minute interval is shown in (C). The time of starting the challenges and TI inhalation is shown in (D). Glucose summary results of all no TI trials are summarized in (E) as mean YSI BG, 1 SD, and minimum and maximum YSI BG values. The control objective (80-140 mg/dl) is shown as the light yellow band and the clinically accepted region (70-180 mg/dl) as the gray band. The mean insulin delivery via CSII for all trials is shown in (F) along with 1 SD and the minimum and maximum of the insulin delivery values. The percentage of subjects received HMS alarms in a 30-minute interval is shown in (G). The time of starting the challenges and TI inhalation is shown in (H).

