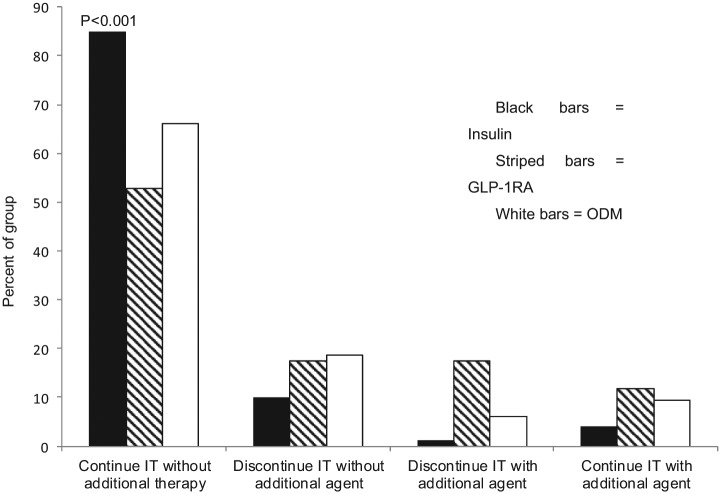
Figure 2.
Percentage of patients continuing intensified therapy (IT) at 1 year with insulin (black bars), GLP-1RA (hatched bars), or a third ODM. Data are presented as the percentage of patients remaining on the assigned IT without the addition of an agent from another group or with the addition of ≥ 1 additional agent(s); or discontinuation of the IT with or without the start of another agent.

