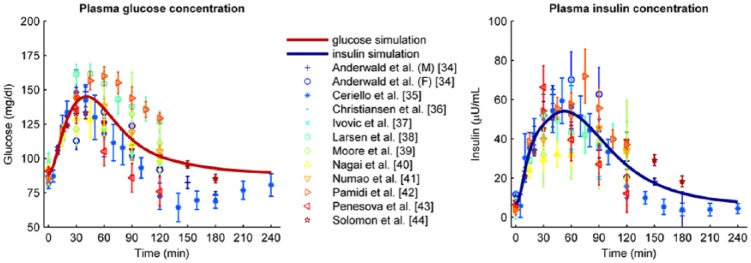
Figure 2.

Parameter estimation data sets (markers and error bars representing mean values and standard deviations, respectively) combined with the optimal model determined by parameter estimation (solid line). The left graph shows the glucose data and model; the right graph shows the insulin data and model.
