
Figure 4.
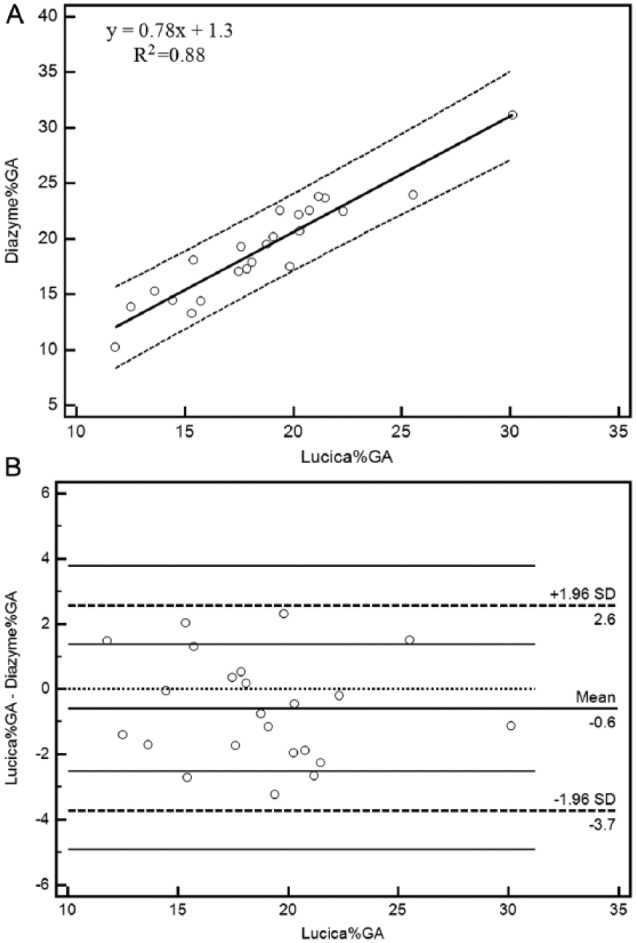
Method comparison between the Diazyme assay (%GA calculated) and Lucica GA-L assay. (A) Least squares regression (solid line), identity line (x = y, dotted line), 95% prediction interval for the regression line (dashed line). (B) Bland–Altman plot, scatter diagram of the differences plotted against the Lucica GA-L method (reference method).