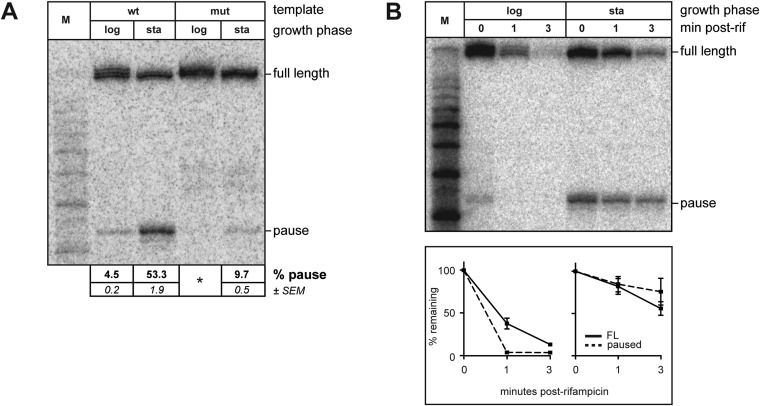
Figure 4. Growth phase dependent σ70 trans loading on a σ28-dependent transcription unit in vivo.
(A). Detection of RNA transcripts in vivo from the templates shown in Figure 2A by LNA probe-hybridization. Transcribed-region sequences that are complementary to the LNA probe are as in Figure 1A. RNA was isolated from SG110 cells harvested at an OD600 of ∼0.5 (log) or ∼2.5 (sta). Pausing is quantified by dividing the signal in the ∼35-nt pause RNA band by the sum of this signal and the signal in the terminated (full-length) band. Mean and SEM of six independent measurements are shown. Asterisks (*) designate values that were too low for accurate quantification. M, 10-nt RNA ladder. (B). top Detection of RNA transcripts derived from the wt template in vivo after treatment with rifampicin. bottom Percent of transcript remaining relative to T = 0 at indicated time points after addition of rifampicin. Mean and SEM of ten (log, 1 m), eight (sta, 1 m), or six (log and sta, 3 m) independent measurements are shown.


