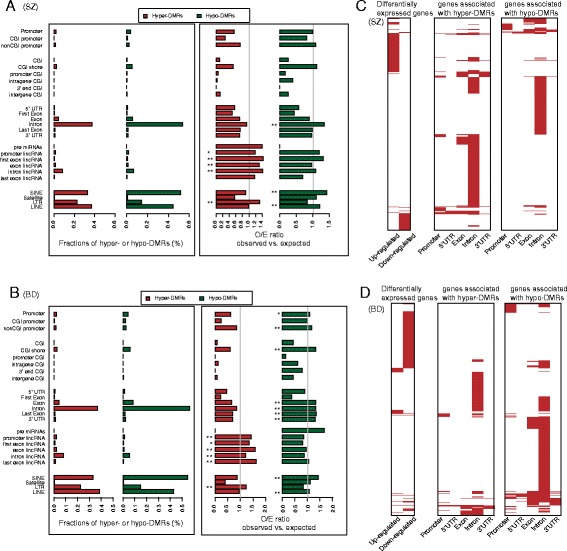
Fig. 2.

Distribution of hyper-DMRs or hypo-DMRs in different genomic elements. a, b Left panel: Each bar represents the fraction of hyper-DMRs (or hypo-DMRs) map to each genomic element in SZ (a) and BD (b). Right panel: The x axis indicates O/E ratios between the observed and expected number of DMRs overlapping with a given type of genomic elements. The average number of DMRs in random sets overlapping with a given type of genomic elements was regarded as the expected value. Asterisks indicating the significance levels (* represents P < 0.05; ** represents P < 0.01). c, d Comparisons between differentially expressed genes and genes with aberrant DNA methylation in different genomic elements in SZ (c) and BD (d). Distribution of up- and down-regulated genes (left), and genes with hyper-DMRs (middle) or hypo-DMRs (right) located in their different genomic elements. For each type of genes, red indicates present
