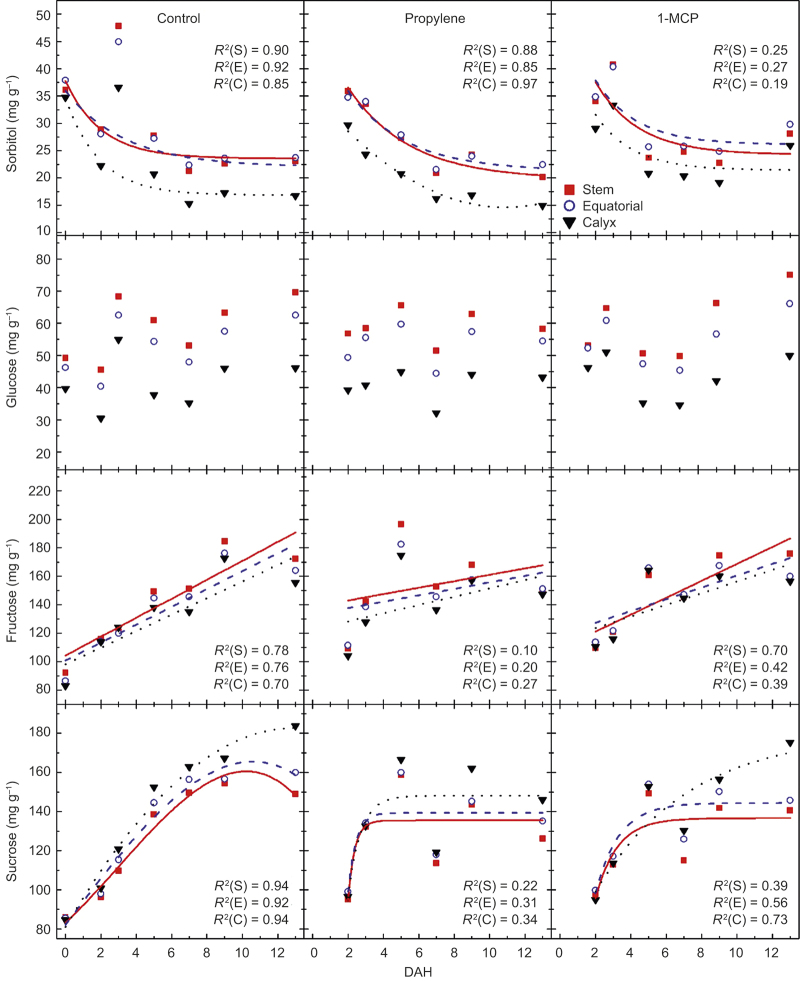
Figure 6.
Sorbitol, glucose, fructose, and sucrose in stem (S; ▪), equatorial (E; ○), and calyx-end (C; ▴) tissues of ‘Gala’ in untreated control, propylene- or 1-MCP-treated fruit from at harvest (0) to 13 DAH. Each mean is the average of five fruits. The R2 describes the exponential or linear fit of the data.

