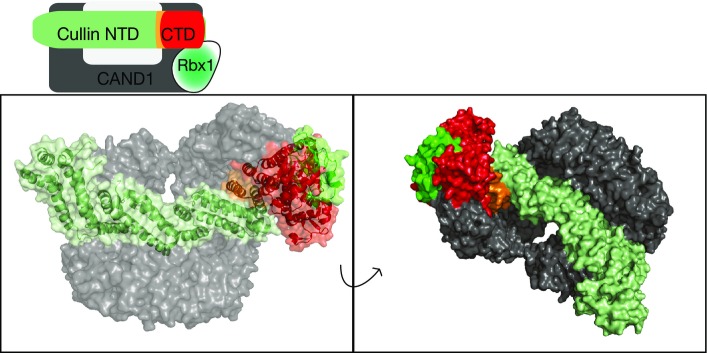
Figure EV1.

Structural context of the area deleted by the disease-causing mutation in CUL3
Top: Schematic representation of the interactions between CRL and CAND1. Bottom: Representation of CAND1 in complex with CUL1-RBX1, PDB 1u6g (Goldenberg et al, 2004). Coloured as shown in the schematic representation. Residues 437–493 of CUL1 (equivalent to 403–456 CUL3) are coloured orange.
