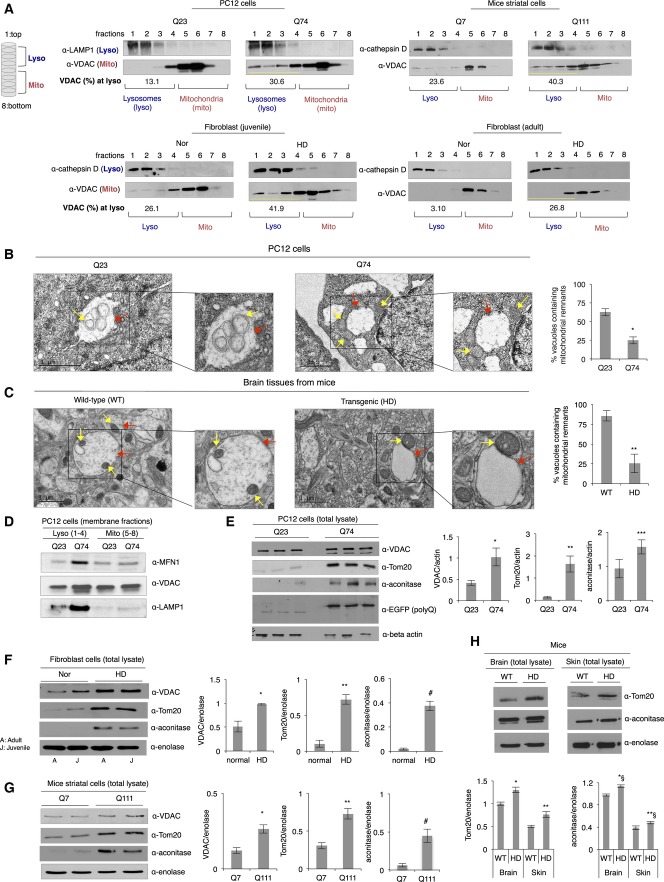
Figure 3.
Expanded polyglutamine repeats affect elimination of damaged mitochondria by mitophagy
- A Representative Western blots showing separation of lysosome- and mitochondria-enriched fractions by a density gradient. Total extracts from different HD models were fractionated by the density gradient. Eight fractions were collected from top (#1) to the bottom (#8). The amount of mitochondria in the lysosomal fractions was presented as a percentage of VDAC present in the entire gradient. n = 3.
- B, C Representative electron micrographs of PC12 cells expressing Q23 or Q74 and brain tissues from wild-type (WT) and HD transgenic R6/2 mice showing mitochondrial (as indicated by yellow arrows) association with lysosomal vacuoles (shown by red arrows). The vacuoles containing mitochondrial remnants are presented as a percentage of the total vacuoles counted. Analysis (of six independent images) was carried out by an observer blinded to the experimental conditions. *P < 0.023; **P < 0.035. Scale bar: 1 μm.
- D Western blot showing association of mitochondrial membrane with lysosomal membrane. The presence of membranes of each organelle was assessed using anti-MFN1, VDAC (as mitochondria markers), and LAMP1 (as a lysosomal marker). n = 3.
- E Representative Western blot showing mitochondrial contents (VDAC, Tom20, and aconitase) in the total lysates of PC12 cells with Q23 or Q74. Mitochondrial protein levels were normalized to beta-actin. n = 3. *P = 0.024; **P = 0.0008; ***P = 0.03.
- F Representative Western blot showing mitochondrial contents (VDAC, Tom20, and aconitase) in the total lysates of normal fibroblast cells and HD patient-derived fibroblasts. Mitochondrial protein levels were normalized to the cytosolic protein, enolase. n = 3. *P = 0.008; **P = 0.002; #P = 0.0008.
- G Representative Western blot showing mitochondrial contents (VDAC, Tom20, and aconitase) in the total lysates of mice striatal cells with Q7 and Q111. n = 3. *P = 0.0008; **P = 0.0007; #P = 0.001.
- H Western blot showing mitochondrial contents (Tom20 and aconitase) in the total lysates of brain tissues from wild-type (WT) and HD transgenic mice. n = 2. *P = 0.02; **P = 0.03 *§P = 0.01; **§P < 0.04.
Data information: The data are presented as mean ± SEM. Statistical significance was assessed by Student’s t-test.
Source data are available online for this figure.

