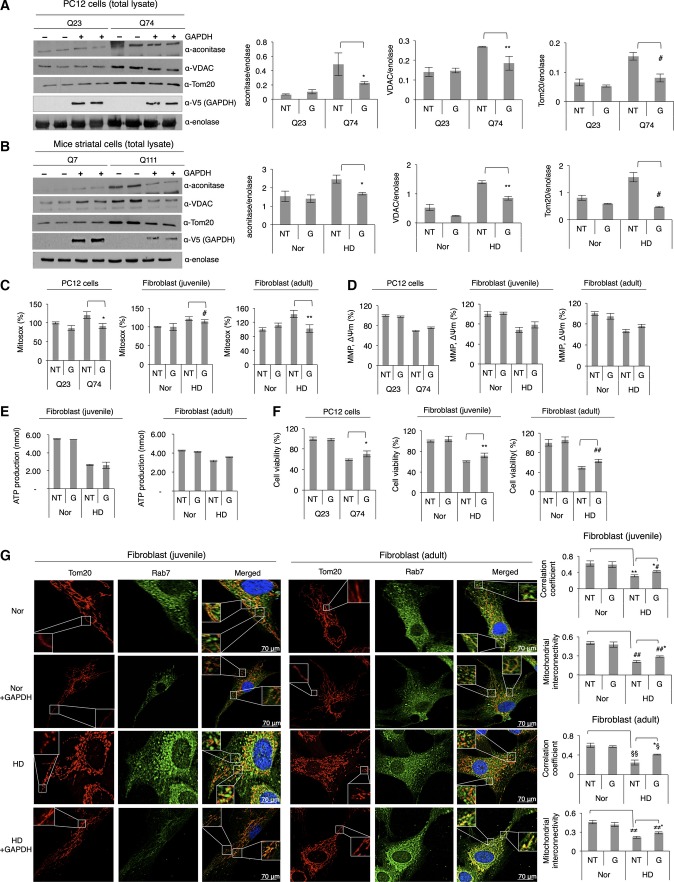
Figure 5.
Overexpression of inactive GAPDH rescues polyglutamine-induced blunted mitophagy and recovers mitochondrial function
- Representative Western blot showing levels of mitochondrial proteins, as indicated by the presence of aconitase, VDAC, and Tom20, in the total lysates of PC12 cells with Q23 or Q74 before (represented as NT: no treatment) and after overexpression of inactive GAPDH (represented as G). n = 3. *P < 0.035; **P = 0.001; #P = 0.001.
- Representative Western blot showing levels of mitochondrial proteins in the total lysates of mice striatal cells with Q7 or Q111 before (NT) and after overexpression of inactive GAPDH (G). n = 2. *P = 0.006; **P = 0.007; #P = 0.001.
- Determination of mitochondrial ROS production in different HD models. Results are shown as percent of control. n = 3. *P = 0.008; #P = 0.054; **P = 0.03.
- Determination of mitochondrial membrane potential using JC-1 in different HD models and control cells (MMP, ΔΨm). The difference in membrane potential between NT (no inactive GAPDH overexpression) and G (inactive GAPDH overexpression) in cells with expanded polyglutamine repeats (PC12 cells with Q74 and HD patient-derived fibroblasts) was not statistically significant. n = 3.
- ATP levels in normal and HD patient-derived fibroblasts. The difference in ATP levels between NT (no inactive GAPDH overexpression) and G (inactive GAPDH overexpression) in HD patient-derived fibroblasts was not statistically significant. n = 2.
- Cell viability determined by colorimetric assays in different HD models and control cells. n = 3. *P = 0.02; **P = 0.02; ##P = 0.01.
- Immunofluorescence of normal and HD patient-derived fibroblasts, with and without overexpression of inactive GAPDH, stained for late endosome with anti-Rab7 antibody and mitochondria with anti-Tom20 antibody. Images were acquired at 63× magnification, and brightness and contrast of all images were adjusted by 30%. Correlation coefficient (juvenile): **P = 0.007; *#P = 0.005. Mitochondrial interconnectivity (juvenile): ##P = 0.001; ##*P = 0.02. Correlation coefficient (adult): §§P = 0.001; *§P = 0.005. Mitochondrial interconnectivity (adult): ≠≠P = 0.043; ≠≠*P = 0.015.
Data information: The data are presented as mean ± SEM. Statistical significance was assessed by Student’s t-test.
Source data are available online for this figure.

