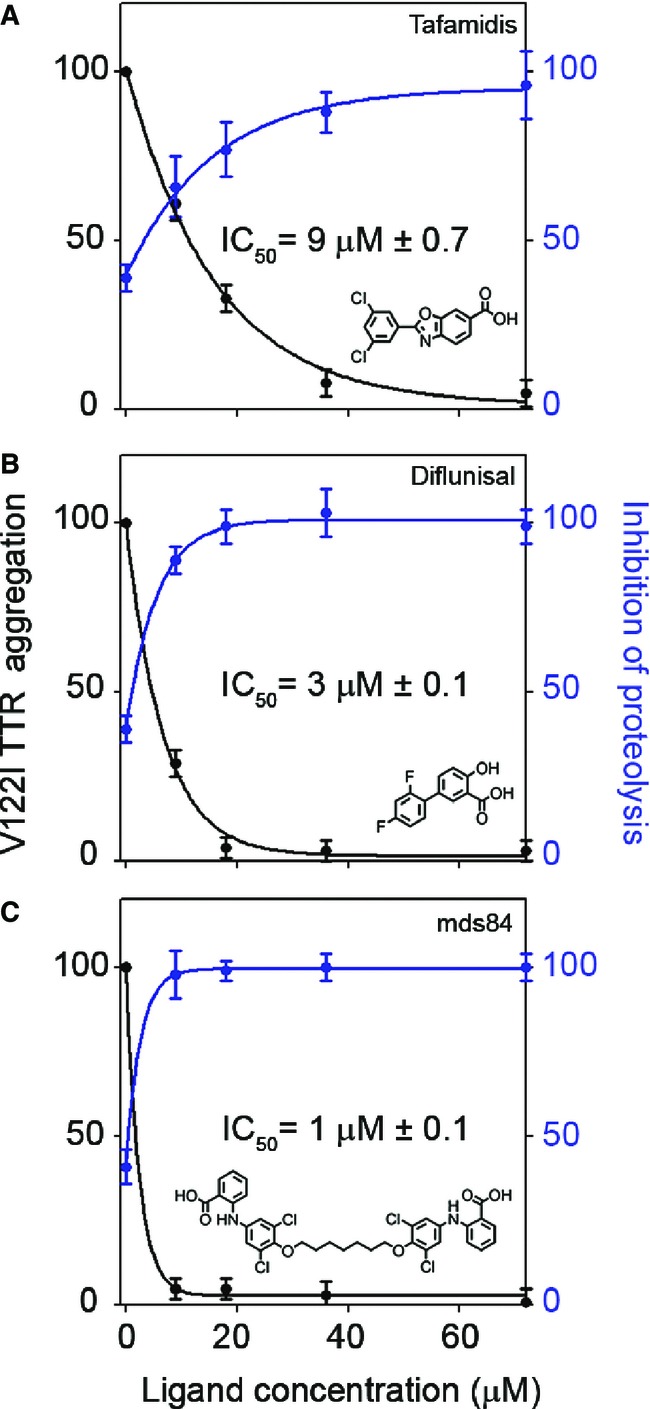
Figure 6.

Proteolysis and fibrillogenesis of V122I TTR in the presence of TTR stabilizing drugs
- A–C Aggregation of 18 μM V122I TTR was monitored by turbidity at 400 nm after addition of trypsin in the presence of 0, 9, 18, 36 and 72 μM of (A) tafamidis, (B) diflunisal and (C) mds84, respectively, for 96 h; aliquots of each sample were analysed by SDS–15% PAGE under reducing conditions. Values of turbidity (black line) at 400 nm were normalized to 100% for aggregation of the protein alone. Intensities of the SDS–PAGE band corresponding to the intact protomer in the whole mixture (blue line) were normalized to 100% for the same band of the protein before addition of trypsin. The solid lines represent the nonlinear fit to the experimental data. IC50 values for TTR aggregation curves and corresponding ligand structures are included. All data shown represent mean ± SD of three independent experiments.
