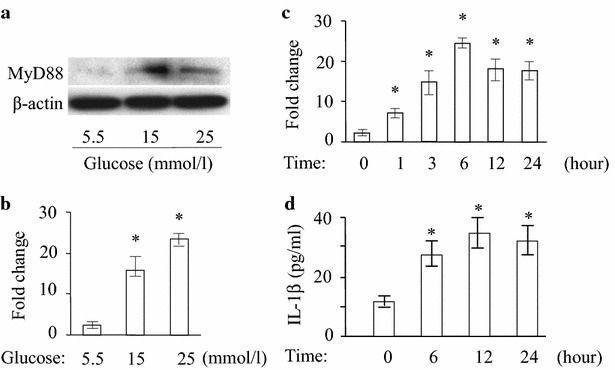
Fig. 4.

Activation of MyD88 and cytokine expression in HMEC-1 cells under high glucose condition. a Western blotting was performed for MyD88 expression in the HMEC-1 cells after exposure to 15 and 25 mmol/l glucose for 12 h. β-actin was used as a control. b Cells were treated with 15 and 25 mmol/l glucose for 6 h. The mRNA for IL-1β was detected by quantitative RT-PCR and normalized to GAPDH. Asterisk indicates P < 0.05 compared to 5.5 mmol/l glucose. c The cells were stimulated with 15 mmol/l glucose for 0, 1, 3, 6, 12 and 24 h. The mRNA of IL-1β was detected by quantitative RT-PCR and normalized to GAPDH to the 0 h group and expressed as the mean ± SE. *P < 0.05 compared to the 0 h group. d IL-1β protein in the supernatants of HMEC-1 cells after high-glucose treatment for indicated time points measured using ELISA. Asterisk indicates P < 0.05 compared to 5.5 mmol/l glucose
