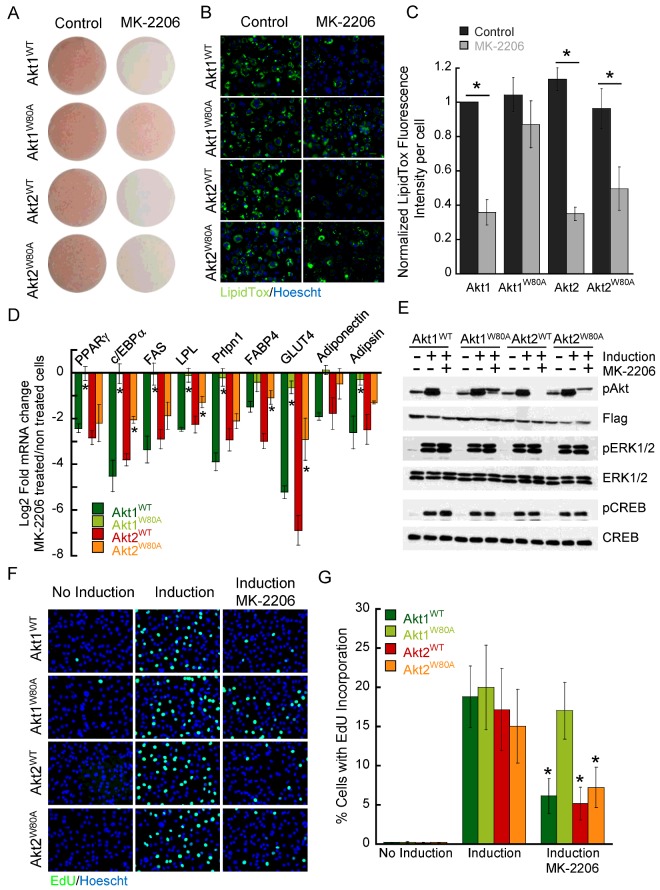
Figure 4. Akt1-specific signalling controls adipocyte differentiation.
(A) Oil–Red-O staining of adipocytes expressing WT or W80A Akt mutants differentiated in the presence or absence of MK-2206. Neutral lipid staining (B) and quantification (C) using LipidTox green stain in adipocytes expressing WT or W80A Akt mutants differentiated in the presence or absence of MK-2206. Bars are the mean of four independent experiments ± S.E.M. *P<0.01 (paired t test) (D) RT-qPCR analyses of adipocyte markers in cells expressing WT or W80A Akt constructs differentiated into adipocytes in the presence or absence of MK-2206. Gene expression was normalized to the housekeeping gene RPLP0. Data represent the log2-fold change in gene expression in MK-2206-treated compared with -untreated conditions. Data are the mean of 3–6 independent experiments ± S.E.M. *P<0.05 (ANOVA). Statistical significance for the data comparisons Akt1W80A compared with Akt1WT and Akt2W80A compared with Akt2WT is shown. (E) Immunoblot analyses of protein extracts derived from pre-adipocytes expressing WT and W80A Akt isoforms. Confluent pre-adipocytes were starved for 2 days and then treated with induction medium for 15 min with or without 2 μM MK-2206. (F) EdU incorporation in pre-adipocytes expressing WT or W80A Akt1 and Akt2 constructs. Cells were kept for 16 h in the presence of growth media (no induction), differentiation media (induction) or differentiation media plus MK-2206 (induction, MK-2206), followed by a 2-h incubation with EdU. Nuclei were counterstained with Hoechst. (G) Percentage of cells with EdU incorporation determined by fluorescence microscopy. Data are the mean of four independent experiments ± S.E.M. *P<0.01 (paired t test induction compared with induction/MK-2206).

