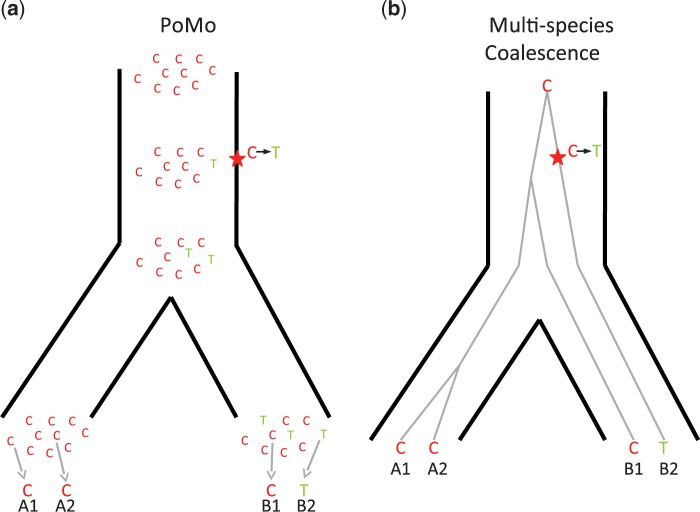
Figure 1.
Comparison of PoMo with the multispecies coalescent. Example of a phylogeny with two species, each with two sampled sequences per population (A1-A2 and B1-B2, respectively). A single alignment site is considered for simplicity, and the observed nucleotides are as depicted: C, C, C, T. a) In PoMo, observed nucleotides are modeled as sampled from 10 virtual individuals (gray arrows at the bottom). Mutations (stars in the figure) can introduce new alleles, and allele counts can change along branches due to drift, and be lost or fixed. The state history shown is only one of the many possible for the observed data. b) In the multispecies coalescent, the species tree (black thick lines) as well as gene trees (gray thin lines) are considered. Usually only the species tree parameters are of interest, and gene trees are nuisance parameters. One of the many possible unobserved gene trees is depicted as an example.

