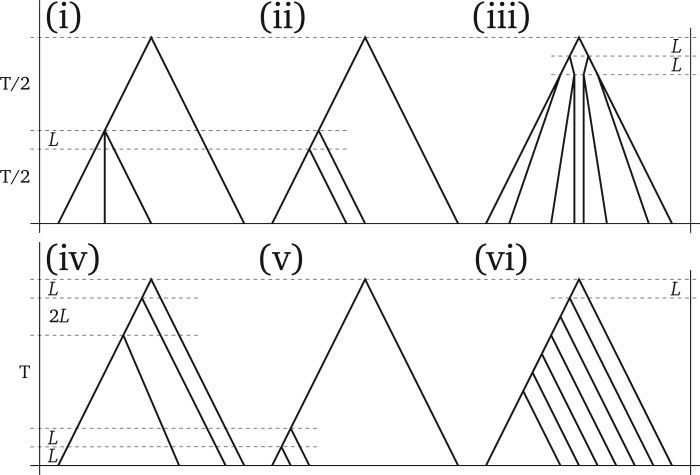
Figure 2.
Species trees used in simulations. We chose trees that are well known for inference problems caused by incomplete lineage sorting. Each of the six trees shown is used in two scenarios: total tree height () is either set to or to generations, where is the effective population size. represents a short branch length of generations. Values not shown are determined by the strict molecular clock assumption. The scenario names are (i) trichotomy, (ii) classical ILS, (iii) balanced, (iv) anomalous, (v) recent radiation, and (vi) unbalanced.

