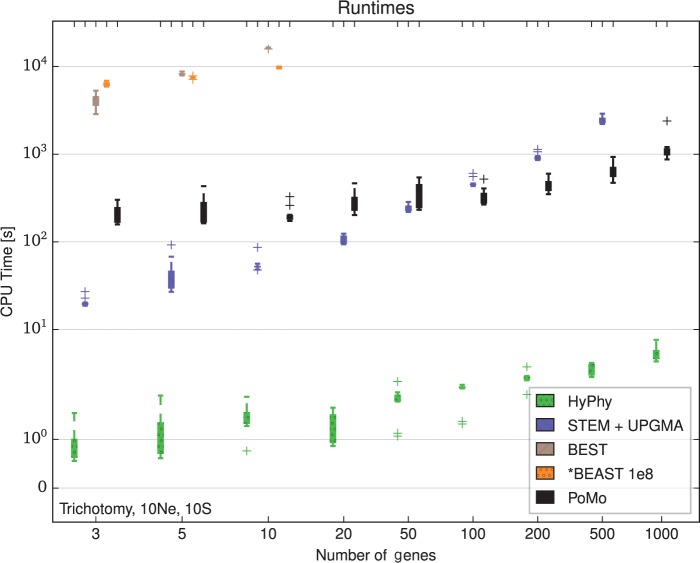
Figure 3.
Computational demands for different methods. Running times for estimation with 10 samples per species and tree height generations in the trichotomy scenario. The Y axis shows the computational time in seconds, the X axis the number of genes included in the analysis. The colors represent different methods (see legend). Each boxplot includes 10 independent replicates. HyPhy applied to concatenated data is the fastest method. STEM estimates the ML species trees from a collection of gene trees provided by the user. We estimated the gene trees with the UPGMA and added the CPU times. For small data sets, PoMo and STEM + UPGMA have comparable computational demands. However, with more genes the CPU time for STEM + UPGMA increases roughly linearly with the number of genes while the time for PoMo remains almost constant. BEST and *BEAST were applied at most to 10 genes. MCMC steps () have been used for *BEAST. Our simulations suggest that methods such as *BEAST and BEST are not efficient enough to analyze large data sets.

