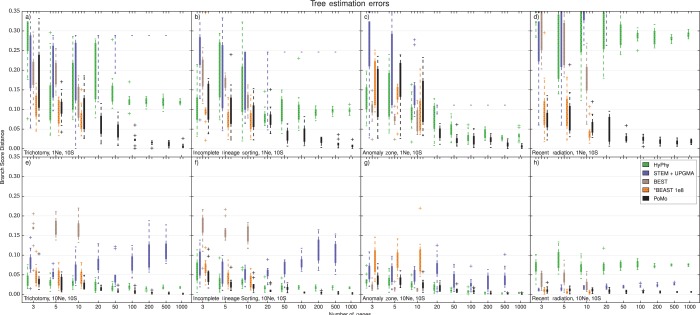
Figure 4.
Accuracy of species tree estimation, four-species-trees. We used BSD to compare the normalized simulated tree and the normalized estimated tree and to measure the error. BSD uses both topology and branch lengths to assess estimation accuracy, providing a broader picture than methods that use only the topology. Higher BSD values indicate larger inference errors. The Y axis is the error in species tree estimation calculated as BSD, the X axis is the number of genes included in the analysis. Four Species and 10 samples per species were included. Each boxplot includes 10 independent replicates. Different colors represent different methods (see legend). a) tree height and scenario with trichotomy. b) tree height and ILS scenario. c) tree height and anomalous species tree. d) tree height and recent population radiation. e) tree height and trichotomy. f) tree height and ILS scenario. g) tree height and anomalous species tree. h) tree height and recent population radiation. BEST and *BEAST were applied at most to 10 genes. MCMC steps () have been used for *BEAST. Note that the alternative methods are often inconsistent, that is, the error in tree estimation did not decrease as more data was added. PoMo shows accurate parameter estimates that converge toward the true values as more genes are included in the analysis in all scenarios.

