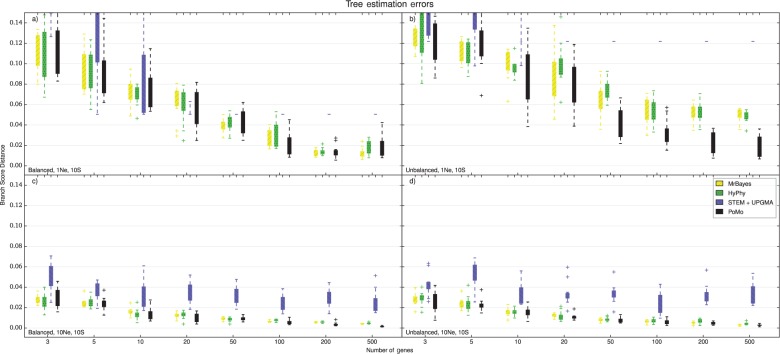
Figure 5.
Accuracy of species tree estimation, eight-species-trees. For larger trees, only PoMo, STEM + UPGMA, and concatenation with MrBayes or HyPhy could be used. Eight species and 10 samples per species were included. The Y axis is the error in species tree estimation calculated as BSD between the normalized simulated species tree and the normalized estimated tree, the X axis is the number of genes included in the analysis. Each boxplot includes 10 independent replicates. Different colors represent different methods (see legend). a) tree height and balanced tree. b) tree height and unbalanced tree. c) tree height and balanced tree. d) tree height and unbalanced tree. PoMo performs much better than STEM + UPGMA, and is slightly more accurate than the two concatenation approaches.

