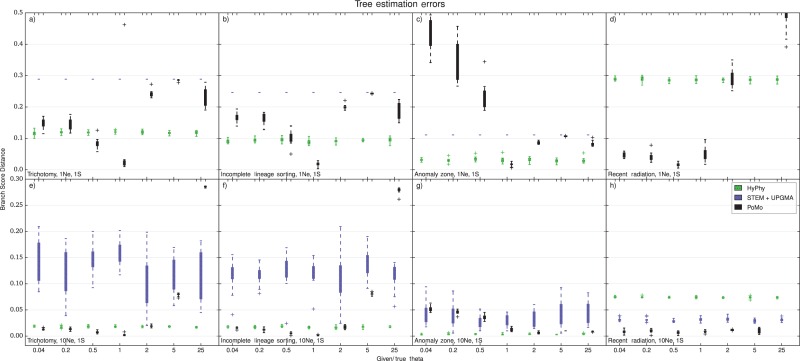
Figure 6.
Errors in tree estimation with one sample per species, four-species-trees. When using one sample per species, a value for the within-species variability has to be specified by the user. The Y axis is the error in species tree estimation calculated as BSD between the normalized simulated species tree and the normalized estimated tree. The X axis is the ratio of the guessed input with the simulated one. Each boxplot includes 10 independent replicates. Different colors represent different methods (see legend). a) tree height and scenario with trichotomy. b) tree height and ILS scenario. c) tree height and anomalous species tree. d) tree height and recent population radiation. e) tree height and trichotomy. f) tree height and ILS. g) tree height and anomalous species tree. h) tree height and recent population radiation. The PoMo estimates are depending on the quality of the guess for . We therefore do not recommend to use PoMo in this situation.

