
Figure 7.
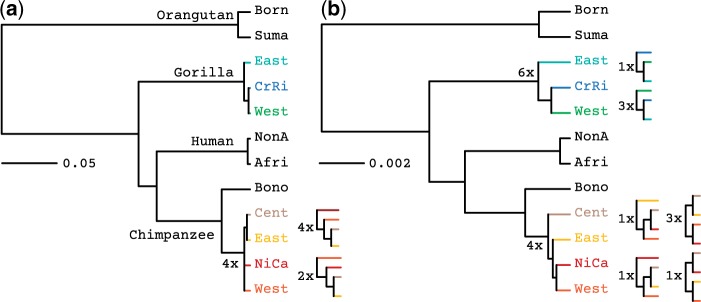
Species tree estimation on the Great Ape data set. Phylogenies were inferred using a) PoMo and b) concatenation. Population names are abbreviated (Born: Bornean, Suma: Sumatran, East: Eastern, CrRi: Cross-River, West: Western, NonA: Non-African, Afri: African, Bono: Bonobos, Cent: Central, NiCa: Nigeria-Cameron. The numbers indicate the abundance of the different clade topologies among different runs (we performed a total of 10 runs per method). The PoMo trees are topologically more stable than the trees estimated from the concatenated data of one randomly chosen individual per species. Interpretation of phylogenetic scales differs between the two methods. In fact, state changes in concatenation represent substitutions, while in PoMo they represent mutation and drift.