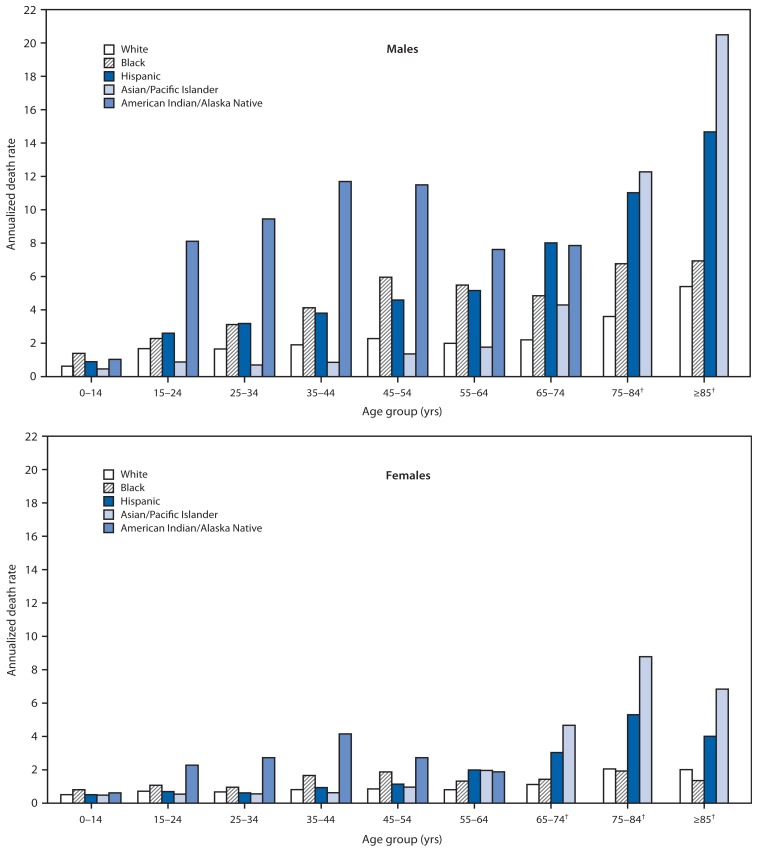
FIGURE.
Annualized motor vehicle traffic-related pedestrian death rates* for males and females, by age group and race/ethnicity — National Vital Statistics System, United States, 2001–2010
* Per 100,000 population.
† Data not shown for American Indian/Alaska Natives in these age groups because of small numbers.

