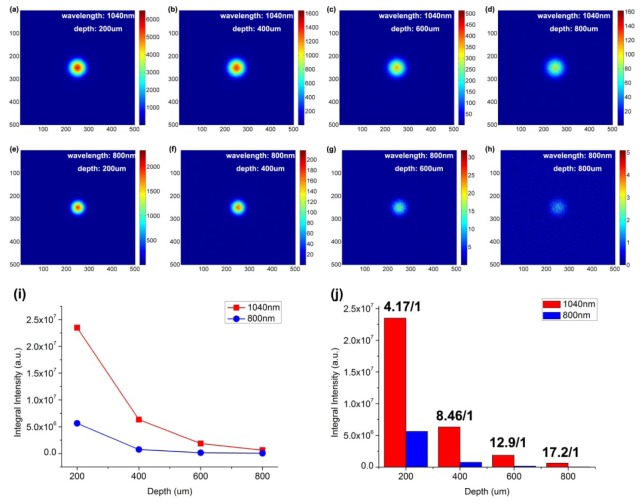
Fig. 4.
Simulation of the light intensity distribution of 1040 nm and 800 nm laser beams in biological tissue at various vertical depths. (a-d) The simulated focal spots of 1040 nm laser beam at depths of 200 μm, 400 μm, 600 μm and 800 μm. (e-h) The simulated focal spots of 800 nm laser beam at depths of 200 μm, 400 μm, 600 μm and 800 μm. (i) The simulated light intensity of focal spots of 1040 nm and 800 nm laser beams at depths of 200 μm, 400 μm, 600 μm and 800 μm. (j) The focal spot intensity ratio of 1040 nm to 800 nm laser beam at depths of 200 μm, 400 μm, 600 μm and 800 μm.

