
Fig. 3.
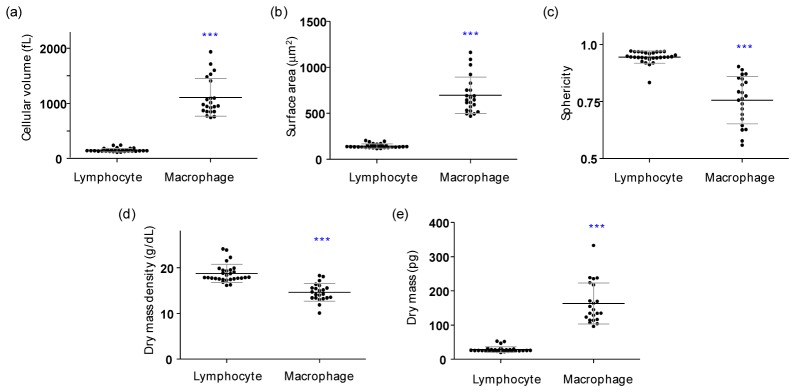
Quantified morphological and biochemical information about individual lymphocytes (n = 29) and macrophages (n = 22). (a) Cellular volume, (b) surface area, (c) sphericity index, (d) dry mass density, and (e) dry mass. Each symbol represents an individual cell measurement and the horizontal black line indicates the mean value with the vertical line of standard deviation. The symbol *** indicates a p-value of < 0.001 in the comparison of the lymphocytes and macrophages according to Student’s t test.