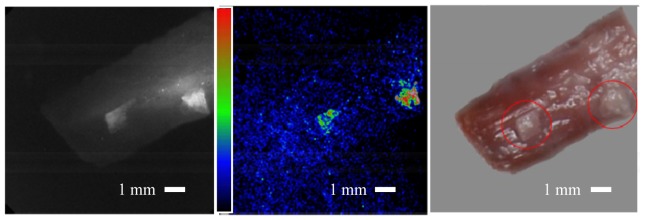
Fig. 3.

Bone on tissue imaging. Right: Conventional color image taken after the experiment showing the tissue sample with 2 pieces of bone on top encircled in red, image rotated on grey background to match fluorescence and Raman images orientation. Adipose tissue and cortical bone fragments were taken from bovine samples. Left: Grey scale image of the fluorescence and Raman signals at optical wavelength of 852 nm (excitation wavelength is at 785 nm), showing both the bone and the soft tissue fluorescence signals. Middle: Raman signal computed image showing the bone locations. The muscle tissue fluorescence signal reduced significantly and showing close to background signal level. Bone signal is measured at about x10 larger than the surrounding tissue, which translate to 20 dB in Signal to Noise Ratio (SNR). Image threshold has been applied, due to laser beam non-uniformity signal levels from the two bone pieces at the two locations are different. Field of view in all images is 1 cm x 1 cm.
