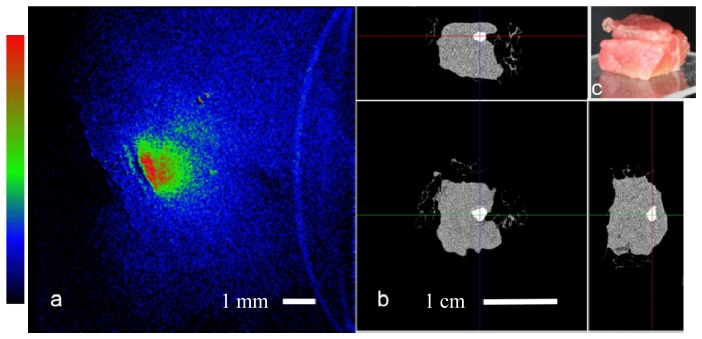
Fig. 5.

Bone embedded in tissue: a. Raman computed image of the tissue sample, the bone (~1 mm in size) Raman signal scattered through the top layer showing diffused boundaries and effectively lowering resolution, field of view is 1 cm. b. microCT projections of the sample, top and perpendicular side views, scale bar 1 cm. c. Angled side view color image, showing top layer of meat (~2 - 3 mm thickness), and a bottom piece (~8 mm).
