
Fig. 4.
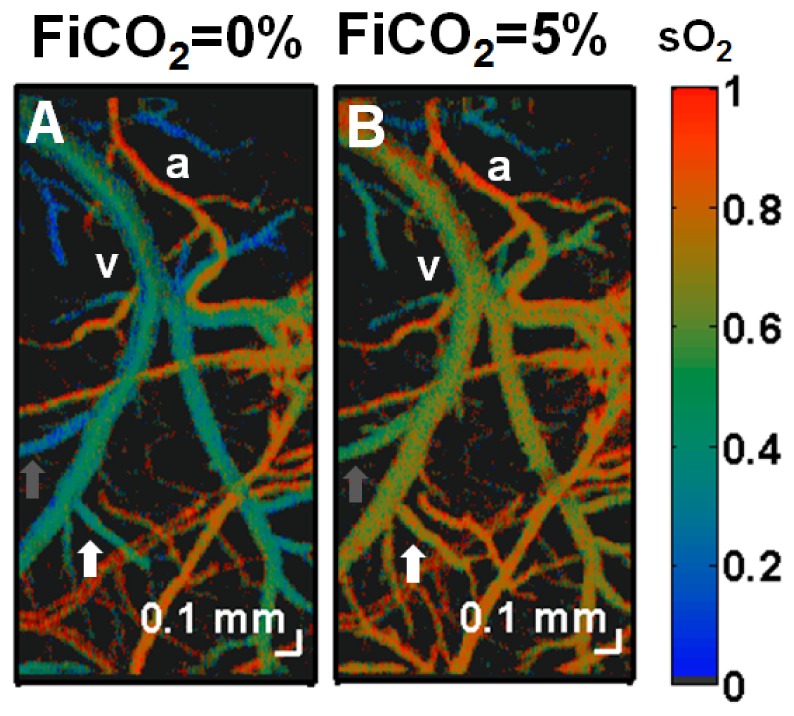
Imaging of oxygen saturation changes during modulation of FiCO2 in the mouse (C57BL/6) neocortex through a thinned-skull cranial window. Microvascular oxygen saturation was mapped using visible light spectroscopic OCT and displayed on a false-color scale during (A) 0% FiCO2, (B) 5% FiCO2. A large increase in oxygen saturation was observed in veins, while the sO2 in arteries remained unchanged. The reduced oxygen extraction is a consequence of arterial and arteriolar dilation and subsequently, increased CBF during hypercapnia. Note the heterogeneity of oxygen extraction, as evidenced by regionally varying venous sO2 values both before and after hypercapnia (white and gray arrows). An artery and vein are labeled as “a” and “v” respectively.