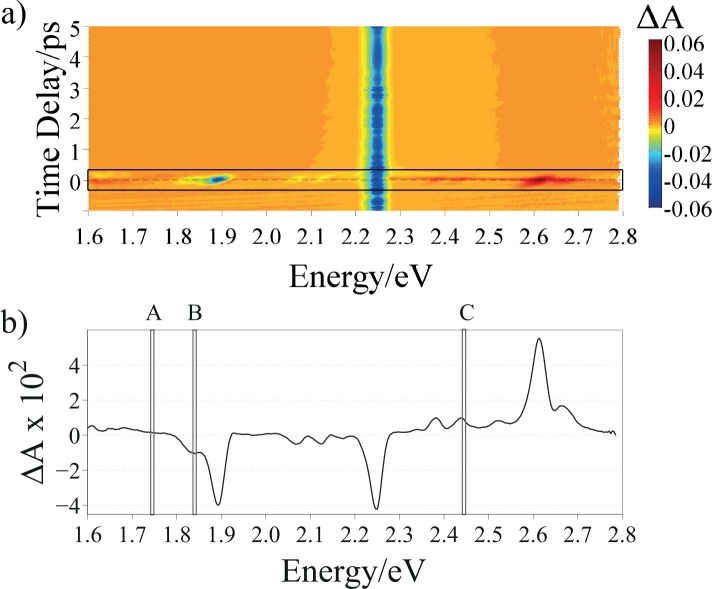
Fig. 4.
a) ΔA 3D matrix of synthetic eumelanin in DMSO-methanol suspension excited at 2.254 eV: probe energy on the x-axes, time delay on the y-axes and differential absorption on the z-axes; the black rectangle highlights the region around τ = 0, whose spectrum is reported in b). The A, B and C regions in b) indicate the energies at which the transient absorption dynamics has been probed and shown in Figs. 6(A), 6(B) and 6(C), respectively.

