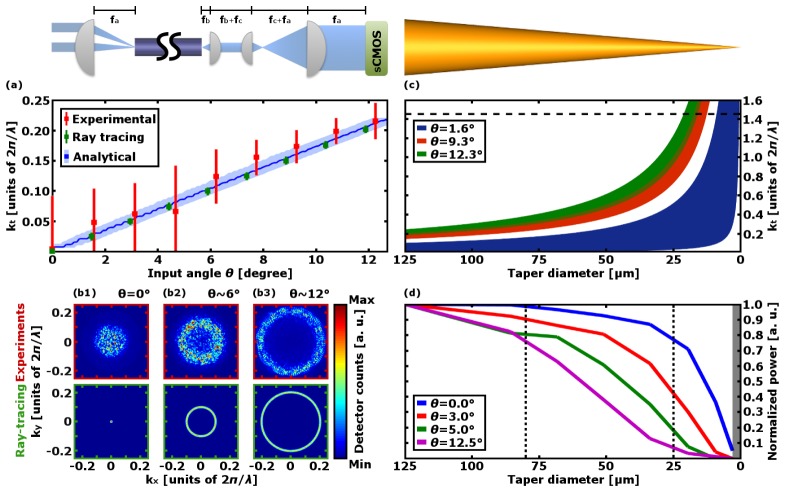
Fig. 3.
(a): Values of kt injected into the optical fiber as estimated by the analytical model (blue curves), the ray tracing model (green squares) and by experimental measurements (red squares). The dark blue curve represents the kt value of the mode excited with the highest power, the light blue area marks the subset of modes carrying at least 5% of the maximum excited power. Green and red bars indicate the kt value at which the detected intensity decays below the 50% with respect to the detected maximum. The upper inset displays the optical setup used to obtain the Fourier transform of the fiber output endface; nominal focal lengths are fa = 100.0 mm, fb = 7.5 mm, fc = 30.0 mm. (b): Fourier transform of the fiber output endface for three different values of θ both for experiments (upper row) and ray tracing simulations (lower row). (c) Evolution of kt values inside the taper for three different values of θ. Each shaded region was computed using both Eq. (3) and the extreme points of the corresponding bar in the experimental data shown in panel (a) as kt values for a taper diameter of 125 µm. The horizontal black line represents the cutoff limit. (d) Evolution of the power confined into the taper for four different values of θ. The two vertical black lines indicate the taper diameters where optical windows are placed. Taper diameters inside the gray area (i.e. below 3 µm) were excluded from the analysis.

