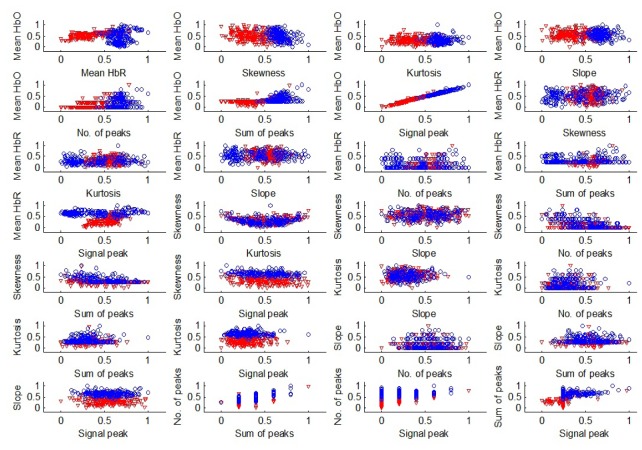
Fig. 6.
28 2-class feature spaces combining the mean ∆HbO, mean ∆HbR, skewness, kurtosis, slope, number of peaks, sum of peaks and signal peak for separating the drowsy and non-drowsy states: The red triangle represents the non-drowsy (alert) state and the blue circle represents the drowsy state (Subject 2, region A, 0~5 sec time window).

