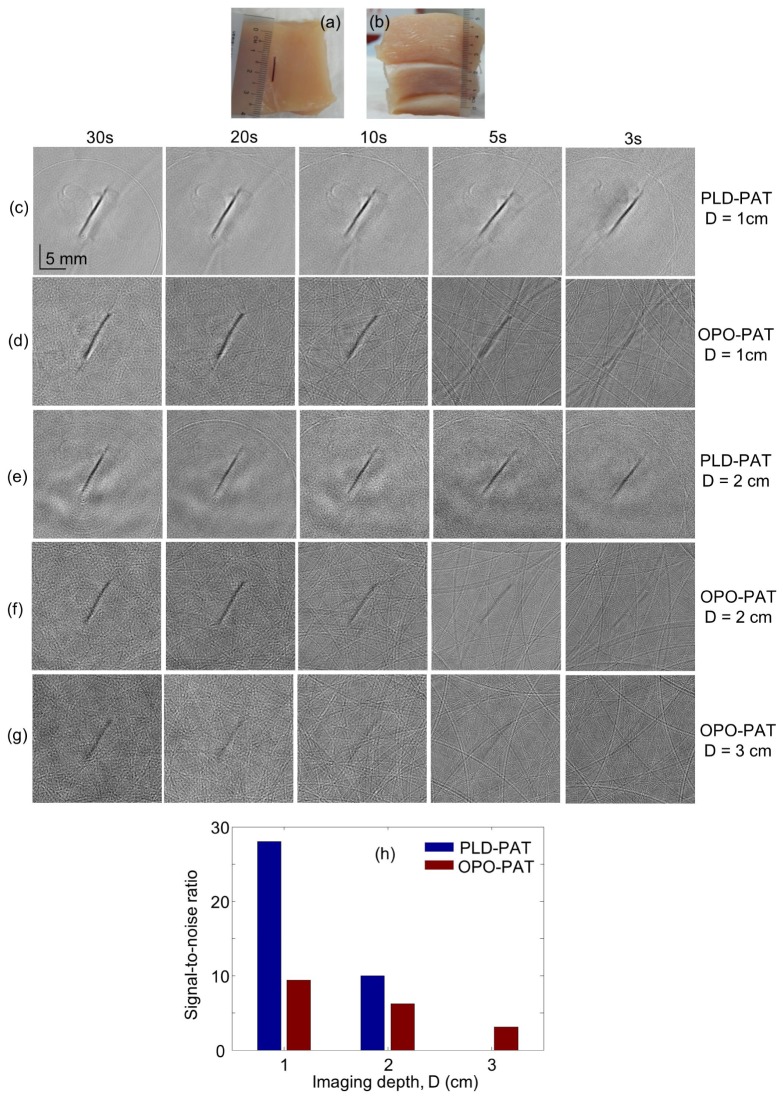
Fig. 4.
Reconstructed images of blood embedded in a chicken breast tissue (CBT) using 2.25 MHz transducer: Photograph of the (a) LDPE tube filled with blood placed on the CBT, (b) stack of CBT layers inside which the blood tube was placed. PAT images acquired using PLD-PAT (c, e) and OPO-PAT (d, f, g). All images have the same scale bar as shown in c. (h) signal-to-noise ratio (SNR) of images acquired in 30 s as a function of imaging depth (D).

