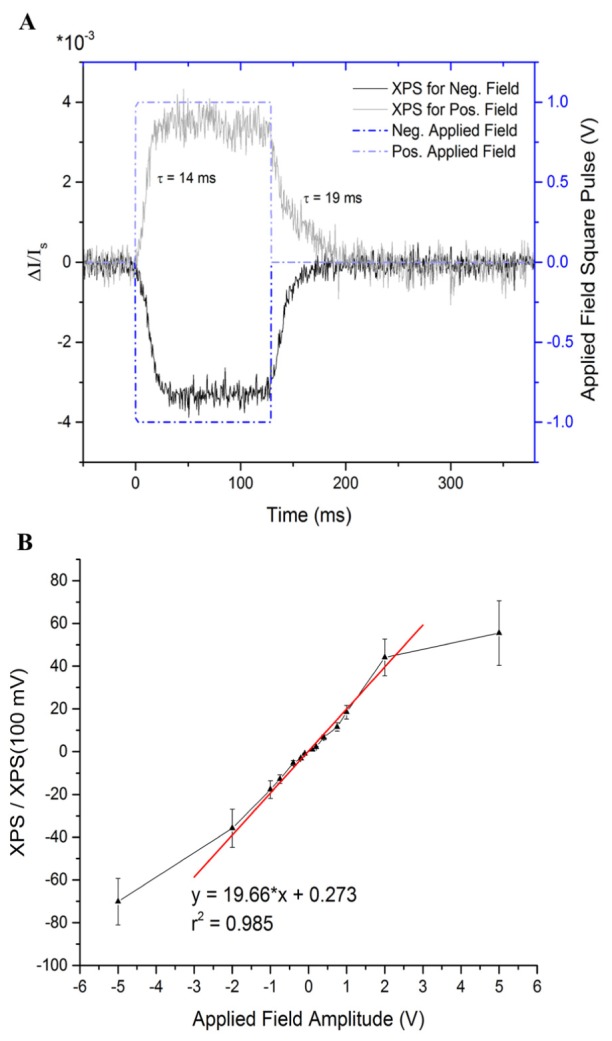
Fig. 5.

A) Example of a stimulus used in the experiment. 1V and −1V, 128-ms square voltage pulses were applied to nerve, and the XPS and stimulus voltage traces are shown together. The birefringence signal closely follows the applied electric field, with time constants of 14 ms rising and 19 ms falling. B) The XPS demonstrates a positive, linear relationship (shown here with a linear fit) to the amplitude of an applied voltage stimulus in the range −2 V to 2 V (data is normalized to the XPS at 100 mV for each nerve, n = 5). The signal saturates beyond that range, possibly related to limitations in the availability of the physiological structures causing changes in birefringence.
