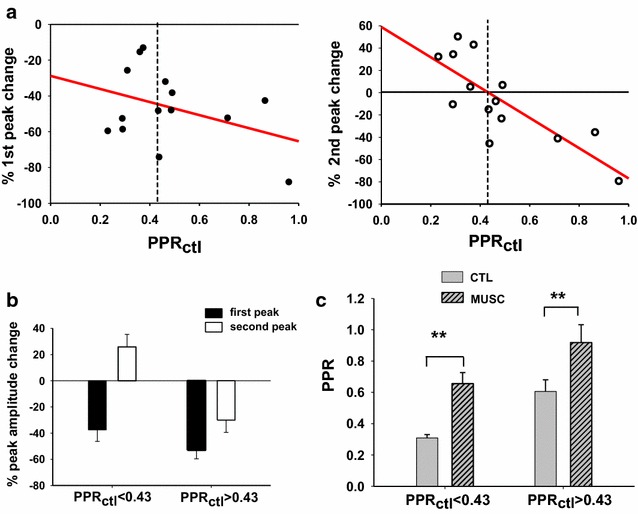
Fig. 8.

Different effects of muscimol on synapses exhibiting control PPRs that are less than or greater than 0.43. a Percentage changes of the first and second eEPSC peak, represented, for each individual neuron, as a function of PPRctl. The first peak is always depressed (left), while the second peak is mainly increased in synapses with PPRctl <0.43 (n = 6) and mainly depressed in synapses having PPRctl >0.43 (n = 8) (right). The regression line is represented for both samples of data. b Average values of percentage peak changes obtained from the data shown in a. c Muscimol causes a significant increase of PPR in both synapse populations (PPRctl <0.43: paired t test, p = 0.009, n = 6; PPRctl >0.43: paired t test, p = 0.003, n = 8)
