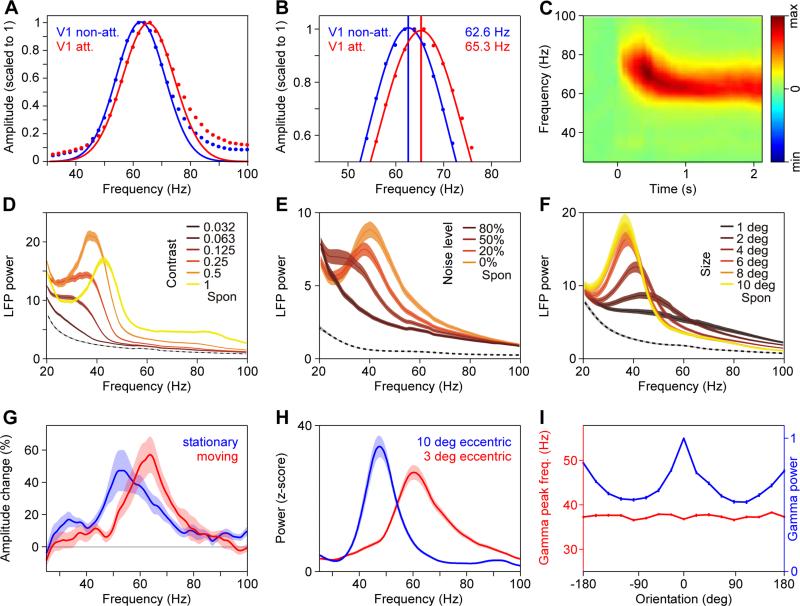
Figure 6. The gamma-band peak frequency increases with attention and salience.
(A, B) Awake macaque V1 LFP power changes (scaled to peak at a value of one) induced by a grating stimulus, when it was non-attended (blue) or attended (red) (adapted and modified from (Bosman et al., 2012)). (B) shows a detail of (A) at higher resolution. (C) Human MEG power change over early visual cortex as a function of time after stimulus onset. Note that the gamma peak frequency is higher at response onset than during the sustained response (adapted and modified from (van Pelt et al., 2012)). (D, E, F) Anesthetized macaque V1 LFP power, during visual stimulation with a grating of varying contrast (D), varying amount of superimposed noise (E), and varying size (F), as indicated by inset color legends (adapted and modified from (Jia et al., 2013b)). (G) Human MEG power change, estimated to emerge from primary visual cortex, during visual stimulation with a grating that is stationary (blue) or moving (red) (adapted and modified from (Swettenham et al., 2009)). (H) Awake macaque V1 LFP power during stimulation with a large grating that activated a recording site with a peripheral RF (blue) and another recording site with a foveal RF (red) (adapted and modified from (Lima et al., 2010)). (I) Anesthetized macaque V1 LFP gamma peak frequency (red line and left y-axis) as well as gamma power (blue line and right y-axis) as a function of stimulus orientation relative to the recording site's preferred orientation (adapted and modified from (Jia et al., 2013b)).

