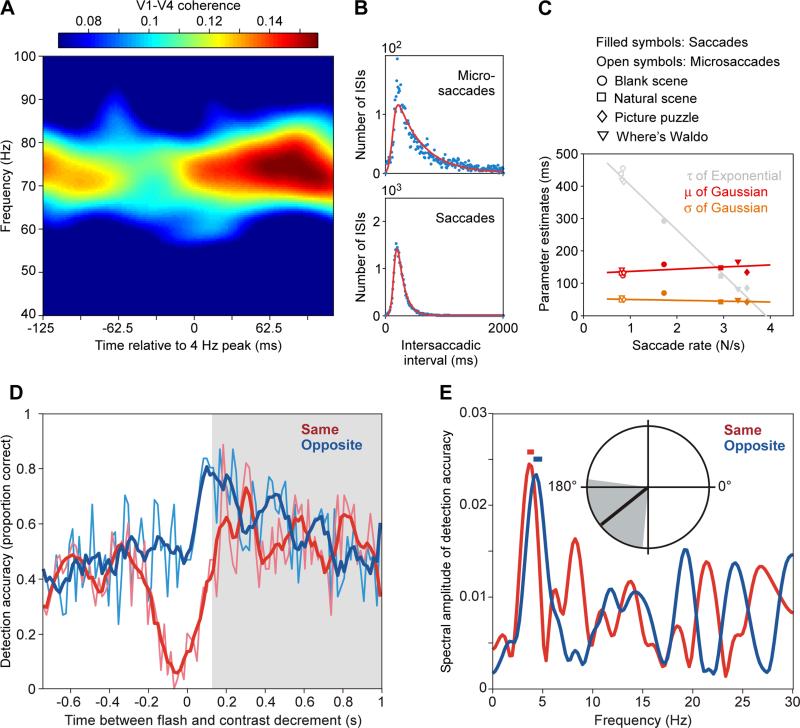
Figure 9. A theta rhythm is visible in visual gamma, saccades and attentional sampling.
(A) V1-V4 coherence as a function of frequency and of time in the 4 Hz theta cycle (adapted and modified from (Bosman et al., 2012)). (B) Histograms of inter-saccadic intervals (ISIs) for microsaccades and regular saccades during free viewing of natural scenes. (C) The histograms of (B) have been fitted with ex-Gaussian functions. The resulting parameter estimates are shown for microsaccades and saccades observed during several viewing conditions as indicated. Irrespective of condition, the Gaussian component's mean was around 145 ms, corresponding to 7 Hz. (B, C) are adapted and modified from (Otero-Millan et al., 2008). (D) Detection accuracy for equally probable contrast decrements on two bilateral stimuli, after an irrelevant flash at time zero. (E) Spectral analysis of the time-resolved detection accuracy from (D). The amplitude spectra reveal peaks close to 4 (D, E) are adapted and modified from (Landau and Fries, 2012).

