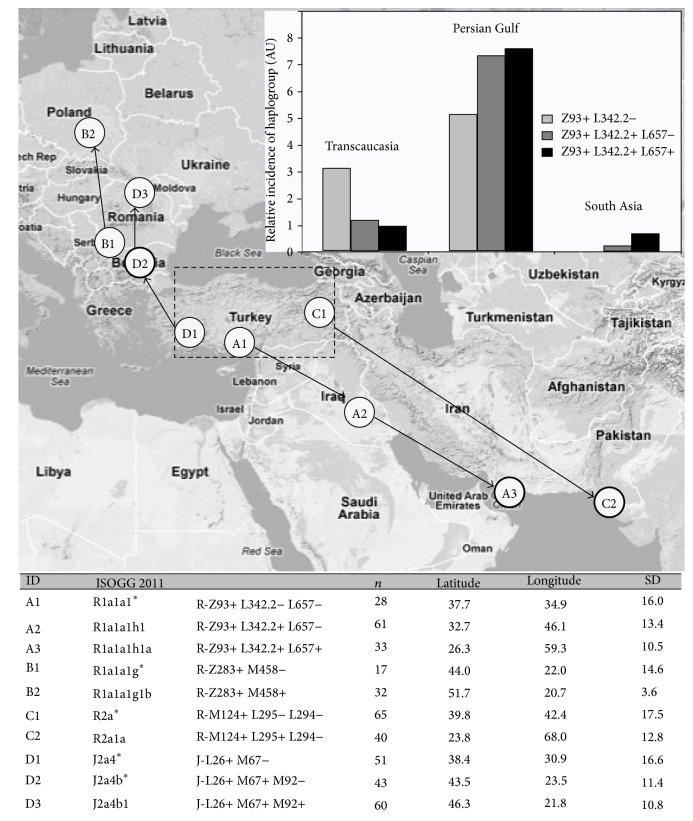
Figure 5.
Net direction of migration deduced from centroid analysis. Centroids and average standard deviations were computed for several obligate allele series as described in Section 2. Each circle in the plot represents an allele. Thick-edged circles are alleles found in the Punjabi Khatri cohort. The bottom panel lists the series used in the computation. Inset: relative incidence of alleles (corrected for country sampling variance) in the public database, October 2012. Transcaucasia zone included Armenia, Georgia, Azerbaijan, and Turkey. Persian Gulf zone included all nations bordering the Persian Gulf, plus Afghanistan. South Asia zone included India and Pakistan. AU = arbitrary units (Supplementary Table S10).

