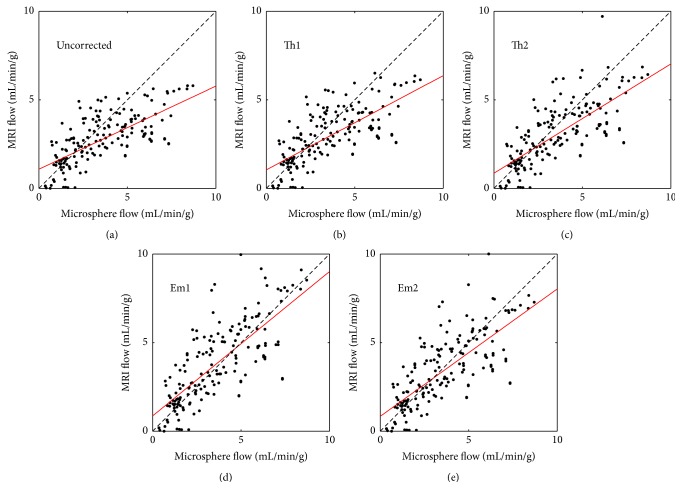
Figure 3.
Scatter plots showing the relationship between the MBF calculated with fluorescent microspheres and MR perfusion imaging for uncorrected MR (a), Th1 (b), Th2 (c), Em1 (d), and Em2 (e). In each panel the line of unity (dashed, black) and line of best fit (solid, red) are shown for reference.

