
Fig. 4.
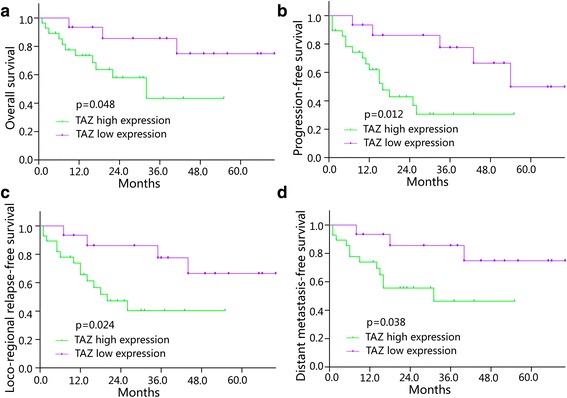
Correlation between TAZ expression and OS, PFS, LRRFS and DMFS in retinoblastoma patients a) The Kaplan-Meier analysis of OS for retinoblastoma patients with the log-rank test. b) The Kaplan-Meier analysis of PFS for retinoblastoma patients with the logrank test. c) The Kaplan-Meier analysis of LRRFS for retinoblastoma patients with the log-rank test. d) The Kaplan-Meier analysis of DMFS for retinoblastoma patients with the log-rank test. *P< 0.05