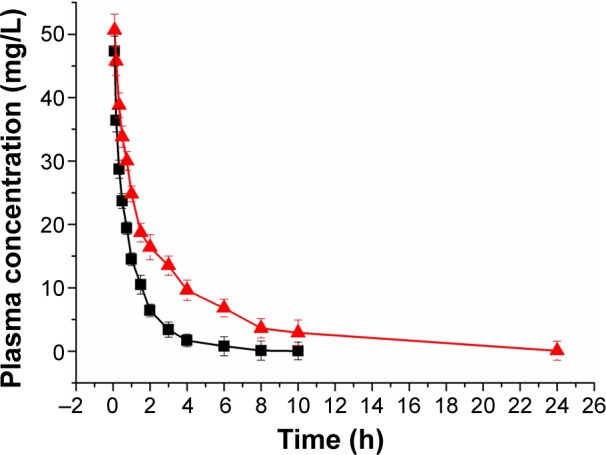
Figure 11.

Plasma concentration–time curves after intravenous administration of DMC-PMs (▲) and sb-DMC (■) in Sprague Dawley rats at a single dosage of 10 mg/kg.
Note: Each point represents mean ± standard deviation (n=6).
Abbreviations: h, hours; DMC-PMs, dimethoxycurcumin-loaded polymeric micelles; sb-DMC, free DMC dissolved in dimethyl sulfoxide.
